Plugin Documentation
Welcome to the Lyscript component, a Python automation control plugin developed specifically for x64dbg debuggers, which simplifies the debugging process. In the field of reverse engineering, when faced with behavior analysis of massive virus samples and vulnerability mining of complex software, traditional manual debugging often requires a lot of time to locate key code and repeatedly execute detection logic, which is not only inefficient, but also prone to missing core information due to human operation.
The launch of this plugin aims to provide a solution for such problems. On the one hand, it reduces the manual burden of reverse engineers through basic automation capabilities, supports core scenarios such as remote dynamic debugging, batch vulnerability retrieval, and automated binary sample analysis. On the other hand, the plugin integrates AI intelligent auxiliary modules and MCP support. The AI module can automatically identify suspicious code segments, generate debugging scripts, and structurally extract debugging logs, helping to address the efficiency and complexity challenges in reverse analysis.
In addition, LyScript relies on Python's rich third-party library ecosystem to provide highly customized tool development foundations for vulnerability mining engineers, malware analysts, and other related fields. Through plugins, users can quickly build dedicated tools to optimize repetitive operations in the debugging process into one click execution, helping to compress analysis cycles and improve work efficiency.
- Copyright numbers of China Copyright Administration: 2023R11L0359520 (original), 2024SR1010782 (modified)
Overview
Specially designed for the x64dbg debugger, this automation control plugin focuses on the needs of the security industry. Through deep integration with the Python ecosystem and debugger, it provides a full process automation solution for scenarios such as reverse engineering, vulnerability mining, and malware analysis.
Its core advantages and functions can be summarized in the following dimensions:
INFO
- Reduce development time by 50%
- A simple and easy to understand interface
- A powerful scripting language for automated intelligent debugging
- Lightweight and fast debugging can prevent damage during complex analysis processes
- Connect to PyPi and Development Tools
The core of this component revolves around reverse engineering and debugging requirements, integrating seven functional dimensions - including debugging control for program execution/pause/single step debugging and breakpoint management, register and flag manipulation, instruction disassembly and machine code assembly, module process information management, memory read-write scanning and protection attribute modification, automated script batch execution, and interactive enhancement of address annotation and GUI log output. It fully supports reverse engineering, vulnerability mining, and malware analysis, replacing manual repetitive operations with automation.
Whether you are a reverse engineer who needs efficient reverse binary samples, an antivirus expert who investigates malicious software behavior, or a vulnerability analyst who locates software vulnerabilities, LyScript can replace repetitive manual operations with automation capabilities, transforming the heavy workload of debugging and analysis into reusable script logic, significantly improving work efficiency and analysis accuracy.
Install plugins
Before using the LyScript plugin for subsequent operations, you need to download the corresponding version of x64dbg debugger.
Through practical testing and verification, the LyScript plugin has no version restrictions on the x64dbg debugger and is fully compatible with all versions without worrying about version adaptation issues. If you have already installed the x64dbg debugger locally, there is no need to repeat the download operation. Simply skip this step.
Next, you need to click onDownload thebutton and save the compressed LyScript plugin file locally. After decompressing the compressed file, two core folders will be obtained: the x86 folder corresponds to 32-bit plugin resources, and the x64 folder corresponds to 64 bit plugin resources.
When installing, you need to select the corresponding plugin based on the number of debugger bits you are using:
INFO
- If using 32-bit x64dbg, drag and drop all files from the x86 folder to the plugins folder in the root directory of the debugger installation
- If using 64 bit x64dbg, drag and drop all files from the x64 folder to the plugins folder in the root directory of the debugger installation
Secondly, it is necessary to install the corresponding version of the Python package. Due to the integration of the LyScript plugin into the official PYPI repository, it can be easily installed. Taking a 32-bit system as an example, open the terminal and enter pip install x32dbg to install it; If it is a 64 bit system, you need to perform pip install x64dbg for installation. Suggest installing two packages simultaneously.
Microsoft Windows [12.0.0.0]
(c) 2025 Microsoft Corporation。

> pip install x32dbg
Collecting x32dbg
  Downloading x32dbg-2.0.0-py3-none-any.whl.metadata (1.3 kB)
Downloading x32dbg-2.0.0-py3-none-any.whl (45 kB)
Installing collected packages: x32dbg
Successfully installed x32dbg-2.0.0

> pip install x64dbg
Collecting x64dbg
  Downloading x64dbg-2.0.0-py3-none-any.whl.metadata (1.3 kB)
Downloading x64dbg-2.0.0-py3-none-any.whl (45 kB)
Installing collected packages: x64dbg
Successfully installed x64dbg-2.0.0

> pip list
Package            Version
------------------ --------
x32dbg             2.0.0
x64dbg             2.0.0
API Call
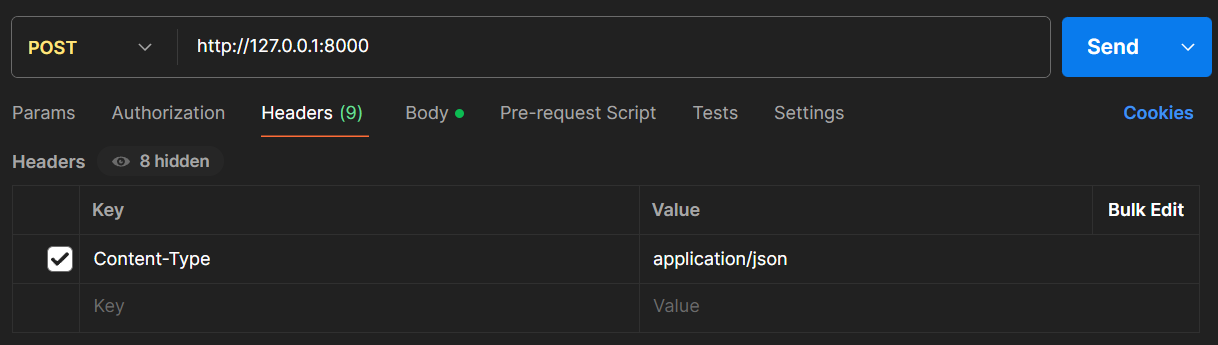
After the plugin is started, the listening service will be launched on port 0.0.0.0:8000 of the local machine. Users can use any tool that supports the HTTP protocol (such as Postman, curl, Postman, etc.) to connect components. Here, Postman is taken as an example to illustrate the specific connection operation:
After opening Postman, select POST as the request method and enter the local access address in the request address bar http://127.0.0.1:8000 If cross device access is required, 127.0.0.1 can be replaced with the LAN IP of the device where the plugin is located. Then, a new field can be added to the request header panel, with the Content Type value set to application/json, to ensure that the request data format can be correctly parsed by the plugin;
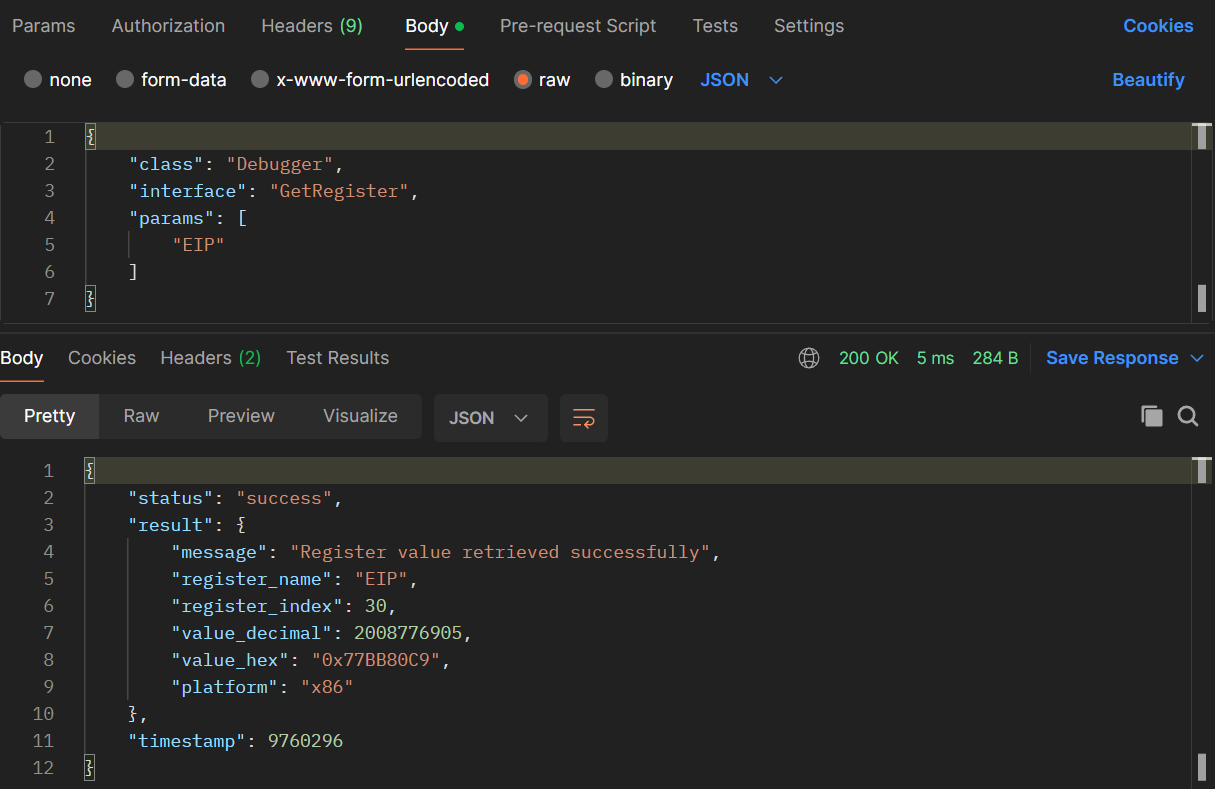
If you need to pass business parameters, you can select the raw format and specify the type as JSON in the Body panel. After filling in the JSON parameters that meet the requirements of the plugin interface, you can send a request to complete the docking. In the example of reading a register, the parameter reading function for that register is achieved by calling the Register interface in the debugger class and passing the EIP register parameter. The same applies to other components.
Module Call
After everything is ready, run the x32dbg debugger and wait for the plugin to load successfully. Open the Python console and import the required modules such as Config, BaseHttpClient, and debugger.
Create a configuration object to specify the service address and port (default 127.0.0.1:8000), check server availability, initialize the HTTP client and debugger instance, and call the functional interface (such as obtaining EIP register values).
Finally, a dictionary result containing register names, values (decimal/hexadecimal), and other information will be returned. Debugging logs can track interaction details.
> python
Python 3.13.7 (tags/v3.13.7:bcee1c3, Aug 14 2025, 14:15:11) on win32
Type "help", "copyright", "credits" or "license" for more information.
>>>
>>> from x32dbg import Config,BaseHttpClient
>>> from x32dbg import Debugger
>>> from x32dbg import Dissassembly
>>> from x32dbg import Module
>>> from x32dbg import Memory
>>> from x32dbg import Process
>>> from x32dbg import Gui
>>> import json
>>>
>>> config = Config(address="127.0.0.1", port=8000)
>>> config
<x32dbg.Config object at 0x00000222561F3620>
>>>
>>> is_available = config.is_server_available()
>>> is_available
True
>>>
>>> http_client = BaseHttpClient(config, debug=True)
[DEBUG] Parsed server URL: http://127.0.0.1:8000/
[DEBUG] BaseHttpClient instance initialized successfully
>>>
>>> debugger = Debugger(http_client)
[DEBUG][Debugger] Debugger instance initialized successfully
>>>
>>> eip = debugger.get_register("eip")
[DEBUG][Debugger] Converted single register input to list: ['eip']
[DEBUG][Debugger] Requesting register values: ['EIP']
[DEBUG] Serialized request body (size: 68 bytes)
[DEBUG] Sending POST request to: http://127.0.0.1:8000/
[DEBUG] Request headers:
{
  "Content-Type": "application/json; charset=utf-8",
  "Accept": "application/json",
  "User-Agent": "Python-Robust-HTTP-Client/1.0"
}
[DEBUG] Request body:
{
  "class": "Debugger",
  "interface": "GetRegister",
  "params": [
    "EIP"
  ]
}
[DEBUG] Received response: Status=200 (OK), Body:
{
    "status": "success",
    "result": {
        "message": "Register value retrieved successfully",
        "register_name": "EIP",
        "register_index": 30,
        "value_decimal": 2008776905,
        "value_hex": "0x77BB80C9",
        "platform": "x86"
    },
    "timestamp": 12603843
}
[DEBUG] HTTP connection closed
>>>
>>> eip
{
    'message': 'Register value retrieved successfully',
    'register_name': 'EIP',
    'register_index': 30,
    'value_decimal': 2008776905,
    'value_hex': '0x77BB80C9',
    'platform': 'x86'
}